September 16, 2019
It has been a hot summer with four new high temperature records in Baltimore between August and so far this September. Reports from NOAA have shown heat to be widespread. But in this weather pattern, did we really set all of those records? Perhaps an audit of our official Baltimore weather station might show some of those days were not as hot as reported.
Baltimore’s official weather station is at BWI- Marshall airport. It has been there since 1950, when it was named Friendship Airport. Before then, the weather station has moved at least half a dozen times in the city of Baltimore. The longest running location was on top of the old Custom House building. There is strong support to suggest it is time for it to move again as it continues to be warmer than all surrounding weather stations. There maybe a reason for it.
Afternoon Temperatures On Sunday
BWI often is warmer than weather station in all directions. It has been more common this year compared to just two years ago. See the data below.

Back in 2010 and 2012, I wrote up reports comping the airport weather station to surrounding Weatherbug stations and identified a distinct warm bias, especially on sunny days. I showed the location between two runways that can carry the enhanced warmth over the official thermometer when the wind blows from certain directions. But this year it seemed to be blatantly obvious. Especially since it has been running warmer than weather stations at the Maryland Science Center (KDMH) in downtown Baltimore, and Washington’s Reagan National Airport (KDCA). Those locations have often been the hotter ones.
I discussed this with National Weather Service (NWS) Baltimore Washington Director Chris Strong, but there was no resolution. Believing the weather data was too warm was just something many regional meteorologists and I had to deal with. But this summer it became evident again. NWS has made a statement that the weather station might have dirt on it, but it was within the acceptable means of temperature variation.
Maxar
Last week a reputable science group named Maxar jumped into the discussion. This technology group includes entities formerly known as DigitalGlobe, Radiant Solutions, and SSL) are also part of numerous satellites in orbit. They won the contract with the NASA to build and fly first lunar gateway mission.
Maxar lended their credibility to the weather station debate.
They posted new information with their WorldView satellite suggesting that new construction in the past 18 months on the grounds of BWI has further enhanced the artificial warming of the official weather station. So the topic is now open for debate again.

In this article I will cover
- Information from Maxar showing new construction at BWI airport and comparing the warming trend to nearby weather stations.
- Humans have changed the local environment and influenced the weather
- Why fixing the weather data to be more accurate is important.
- The precedence established by NWS to retroactively change (lower) prior weather data. So it can be done again.
Why is BWI weather station hotter now?
Simply put, there is new asphalt and a new building under construction in the nearby vicinity. This satellite comparison was recently posted by Maxar’s Earthview. They are a company that has a few satellites and is working with NASA on the return to the moon. They used their Worldview Satellite to show the high resolution view of what has changed at BWI from January 20, 2018 to July 29, 2019
Here is a closer look at the comparison view shown above:
In January 2018, the area next to the ASOS (Automated Surface Observation Station) weather station marked in yellow, had older pavement with a lighter color with heavy vehicles parked. Next to that was a large untouched field.

In July 2019, that same area has new darker pavement. This is likely to heat up more on sunny days. That old grassy field has been cleared. A new building is under construction surrounded by large cleared dirt area.

Tweet from Maxar
Follow Up Data comparing the same time period over the past 3 years:
Some additional data Maxar reported is shown below. This is something that resonates in the scientific community because of the lack of accuracy. If we are to measure our environment and any changes in climate, we should make sure we are getting it right.
Increasingly Warmer Than Nearby Weather Stations
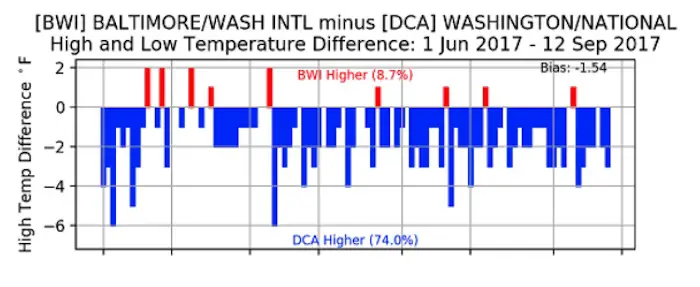
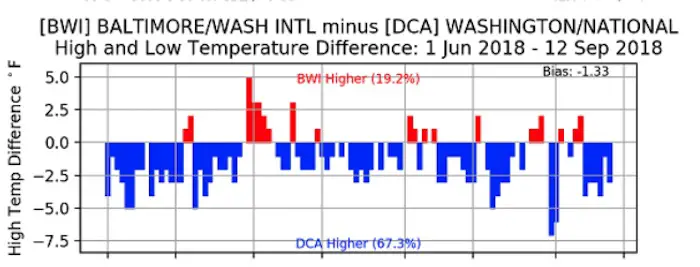
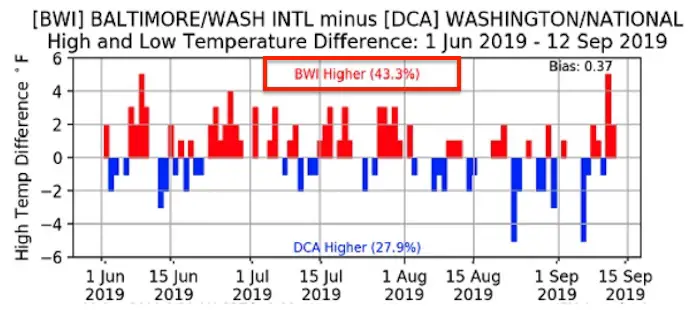
Here is a comparison between BWI and Washington’s Reagan National Airport (DCA) over the last 3 years. Using the same time frame of June 1 to September 12. BWI has historically been cooler, with only a handful of days warmer.
*2017 BWI was warmer only 8.7% of the time
*2018 that increased to 19.2% of the days warmer at BWI
*2019, that increased to 43.3% of the days warmer at BWI.
- A jump of 34.6% more warmer days at BWI in just two years.
- DCA dropped from 74% of the days being warmer in 2017 to 27.9% of the days in 2019. A drop of 46.1% in the same time span
[adrotate group=”4″]
Follow Up Tweet with this information from Maxar
Note: Their data is in reverse chronological order
NOAA Weather Station Guidelines
A newly paved area with distinct blacktop has a high capacity to absorb and radiate heat, and this is adjacent to the weather station. Too close as defined by NOAA guidelines:
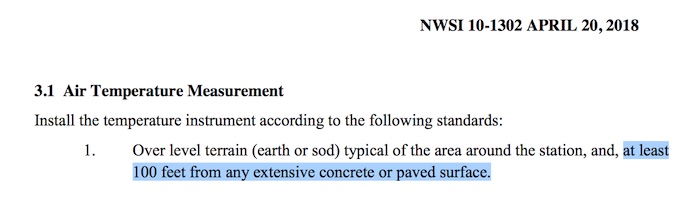
Section 3.1 Air Temperature Measurement; paragraph 1:
“at least 100 feet from any extensive concrete or paved surface”.
I believe a location between a runway and additional paved area should be larger than 100 feet separation anyway. But given the established rules and add in the new construction, we have additional warmer surfaces to the south and southwest. This is where the wind blows from on many hot days.
Hot Years Are Common
The historical weather records for Baltimore go back to 1880. Regardless of the location of the weather station at the time, there are clusters of weather records in some years that stand out. The four new high temperature records at BWI since August can be compared to many other years to prove that when it gets hot, it can remain hot.
High Temperature Records Clustered In Some Years
2019
- August 18 = 96ºF
- August 19 = 96ºF
- September 4 = 96ºF
- September 12 = 97ºF
1970
- September 23 = 98ºF
- September 24 = 95ºF *Tied again in 2010
- September 25 = 97ºF
- September 26 = 95ºF
1931
- September 12 = 96F *Broken this year
- September 14 = 94ºF
- September 21 = 96ºF
- September 22 = 99ºF
This is one of those years that shows up a cluster of weather records in our hot patten. But if we were to examine and audit the accuracy of the data reported now, it might be low enough to change some new records set.
[adrotate group=”4″]
Humans Changing The Environment
This summer the world was in an uproar about the burning portions of the Amazon Rainforest, the lungs of our planet. Besides the smoke release into the atmosphere, when any vegetation is removed, we lose the natural mitigating effects of solar heating. In short, without trees, shrubbery, and grass, the nearby areas inevitably heat up.
Paved surfaces heat up more in the sun
We see this in cities around the world that experience the Urban Heat Island Effect. Cities can be 5 to 10 degrees warmer than surrounding suburban and rural areas. This heat is retained at night, and starts the following days off hotter. It is heat that builds on heat in developed areas.
A weather station should be next to grass in our region to be accurate. It is elevated to diffuse any direct ground warming. When it’s next to pavement or between paved areas it is highly likely that heating is enhanced artificially. We saw this with the weather station at Baltimore’s Inner Harbor. It is located next to the Maryland Science Center, which already is too close to a tall building and blocks the wind with natural air mixing. But when a solar panel covered car port was build less than 50 yards to the south, days with the wind from that direction were reported as significantly warmer.
BWI weather station location Concerns
This has been an issue for a long time. This article from Anthony Watts in 2010 gave extensive details on the problems with the BWI weather station
I had discussed this with many other area meteorologists who have agreed it is outside an acceptable standard deviation or error. It nothing else, it should require a scientific analysis.
Why is this important?
- Scientific accuracy is the top reason. Meteorology is a field of science that relies heavily on diligent data observations and record keeping.
- Accurate records: In an era of heightened awareness of warming temperatures, we should have valid documentation of how hot our areas is. This is even more important when compared with past weather and noting any changes.
- Computer Model Forecasting! Weather data is digested and incorporated into a portion of the calculations computer models use to generate forecasting. If we add in improper data for our region, that could further disrupt the computer guidance for weather prediction. This will be most evident in storm development in any season. It can be even more critical in winter events. It’s hard enough to predict where a rain/snow line might set up, let along how much snow will accumulate in a given location. Tacking on higher temperatures than justified for our general area might not translate properly.
Weather Records Have Been Changed Before
In our epic winter of 2009-2010 we had a season total of 77 inches of snow. This included three blizzards in our area. One was in December, and two of them were in early February.
Towards the end of that first blizzard (Feb 5-6), BWI was about to set the all time single event and 24 hour snowfall records. A statement was put out by NWS referring to that, with a few hours of accumulating snow to go. But at the end of the event, the snow report was blank. A few days later it was shown to be 24”, lower that the snow report before the storm ended. Also lower that the 31 inches reported from an NWS employees that lived in nearby Catonsville.
What happened to the snow in 2010?
After some persistent questioning, I got an answer from NWS. It was determined that the snow measurements at BWI were not compliant with NWS guidelines. An FAA employee had been measuring snow at the airport. Since government budget cuts in 2000 removed the NWS observer, an FAA observer did the snow measurements. This led to a difference in how the snow was measured and they noticed a decade after the change was made.
- NWS uses an elevated shite board. It is cleared every 6 hours to limit heavy weight compacting and lowering snow amounts.
- FAA employee used a different method, clearing the snow more frequently.
As a result, NWS discarded the snow measurements and questioned results as far back as 1998 according to a Baltimore Sun article by the respected Frank Roylance.
Retroactively Lowering Snowfall Records
The National Weather Service stated they would apply an algorithm to retroactively lower prior snowfall totals they questioned.
Baltimore still had a record 77 inches of snow that year, but may believe the records should be higher.
Side note: I remember there was an issue with the weather station in Chicago in the 1990s. A thermometer placed by the vent exhaust for the building. That was addressed and the temperatures were retroactively lowered. Adjustments have been made before.
Snowfall Measuring Debate
Capital Weather Gang chimed in with this article in 2016: Official Observers Should Measure Snow Like Everyone Else
What To Do Next
First, it is important to follow the scientific guidelines that are in place. A decade ago a private group called Surface Stations conducted an audit and found that over 80% of weather stations in the US fail to adhere to one or a few portions of the NOAA/NWS guidelines. That group’s website is not active, not the articles Tony Pann or I wrote could not be found online, or I would link them here.
My Suggestions for NWS about BWI:
- Determined the artificial heating and apply the same algorythm to lower the temperatures at least this year, perhaps the last two years. NWS as already established the precedence to retrofit weather data. As with the snow records, this would change the temperature records, including the likely chance that 5 days of record highs this summer might be removed from historical records.
- Move the weather station (ASOS)! It should remain on the grounds of BWI, but in a location away from the influence of the heating from runways and structures.
I am in agreement with a few local meteorologists that have questioned the high temperatures at BWI for the past few months. I have discussed the artificial warming of the automated weather staton (ASOS) from nearby runways with a few scientists in our region. Both Tony Pann and Tom Tasselmeyer, my former colleagues at WBAL, have expressed their concern. Tom has called Chris Strong at NWS and waiting for a reply. If I hear anything from that attempt, I will pass it along to you.
Why are weather stations at airports when no one lives there?
In short, the FAA requires accurate weather data for the safety of flights departing and landing.
The problem as we have seen at BWI is that expansion can encroach on the weather station and limit the amount of free space available to fit NWS guidelines.
There have been some audits of weather stations around the nations and globe, with many showing they are not compliant with the guidelines. But how much emphasis is made to rectify this? How important is it to accurately document weather records?
Something to think about. I hope NWS takes BWI seriously.
What do you think? I’d like to know.
Please share your thoughts, best weather pics/video, or just keep in touch via social media
Keep In Touch Every Day
Just in case you don’t get all posts on your social media feed, stay up to date with the latest info…
Click here to sign up for email alerts…. Be the first to hear any new weather
[adrotate group=”4″]
Maryland Trek Cycle Jerseys From Hill Killer
All proceeds will go to the Maryland Trek 6 total and Just In Power Kids programs

Thank you to our Title Sponsor for Maryland Trek 6
Shining on with Smyth and their contribution, our team has raised over $95,000 for Just In Power Kids to provide free programs for kids in and post cancer treatment.

Just In Power Kids:
Proceeds go to our programs Providing FREE holistic care for kids in cancer treatment and up to 5 years post treatment and caregivers.

Shine On
Proceeds from all sales go to Just In Power Kids. Click the image to shop and show your support.

Love Maryland Shirts and Hoodies
This shirt was designed by my ‘bonus’ daughter Jaiden. The hoodie has been the biggest hit, so our promotion has been extended until the end of this week.
|
|
|
Order Here
Show your love for Maryland and make this 14 year old artist and her mom extra proud
|